Dynamic Crystalization of Cellulose I
Susan Cousins and R. Malcolm Brown Jr.Department of Botany, The University of Texas at Austin, Austin, Tx., 78713
ABSTRACT
Crystallization of cellulose is interesting because the native form found in higher plants and most other cellulose producing organisms is a metastable crystalline allomorph, cellulose I. Cellulose crystallization has been predominantly analyzed using various fluorescent brightening agents (FBAs) which interrupt glucan chain associations. The most common FBA used, Tinopal LPW™, has given conflicting results in the literature. Previous research on dye altered cellulose has supported two opposing bonding schemes within a glucan minisheet: van der Waals forces and hydrogen bonds. Presented here is morphological an molecular modelling evidence supporting a 3-ply sheet construction for the dye-altered glucan sheets. Energies calculated by molecular mechanics indicate that -1,4 linked glucan minisheets most likely would form by van der Waals forces. A 9.4 Å reflection previously reported has been re-interpreted to provide evidence for folded glucan chains interacting with the dye molecules. Based on the presented approaches and research, a revised mechanism of cellulose I crystallization is proposed.
INTRODUCTION
The most common natural allomorph, cellulose I, consists of microfibrils in which the glucan chains are parallel and extended. Recent studies of cellulose I synthesized in vitro and abiotically are intriguing because cellulose I is the metastable state. Thus, the in vitro and abiotic systems must be mimicking in some way the conditions favored not only for -1,4 linked polymerization, but also for crystallization into a less stable state.
In an abiotic system, cellulose I has been produced by micelles formed from optimized organic solvent and aqueous buffer ratios. This system produced very thin microfibrils only 1-2 glucan chains thick. Such thin microfibrils correlates well with the concept of glucan sheet formation being the first step of crystallization as proposed in various dye altered cellulose studies,,,. Thus, if glucan chain sheets are considered as the first stage of crystallization, it becomes of great interest to determine which bonding scheme is more likely leading to sheet formation.
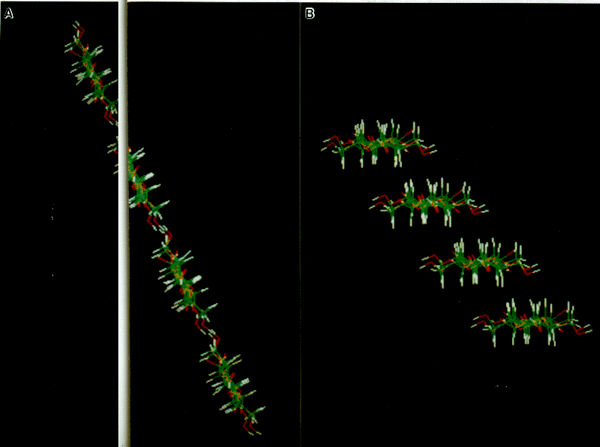
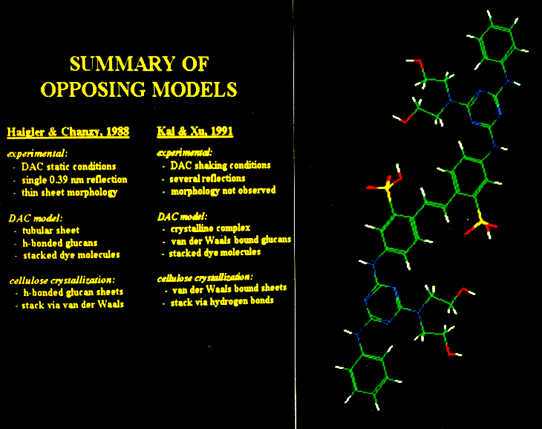
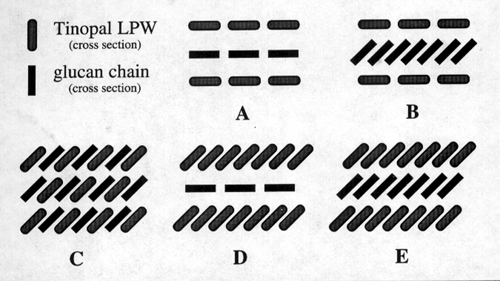
While the hierarchical levels of cellulose crystallization have been described previously,,, the bonding between the glucan chains in the initial stages of crystallization has been disputed. One model (Fig. 1A), which is more widely accepted, proposes that glucan chains are linked by hydrogen bonds to form two-dimensional sheets. These sheets then associate through van der Waals forces to form a microfibril,. In an alternative model (Fig. 1B), the mini-sheets assemble by van der Waals forces, and the microfibril forms when mini-sheets bind together by hydrogen bonds,. Both models claim support from crystallographic studies of dye-altered cellulose (DAC) synthesized by Acetobacter xylinum in the presence of high concentrations of the fluorescent brightener Tinopal LPW™ (Fig. 2). Differences in interpretation of results may have arisen from different methods of synthesis (shaking vs static conditions). Therefore, the various structural interpretations may be evaluated by repeating the different synthesis conditions and observing the products with electron microscopy and x-ray diffraction.
To further test which bonding is preferred, energy minimization using the molecular mechanics program MM3, was used. This system has been employed to model the various allomorphs of cellulose as well as many other carbohydrates,,. By modelling the glucan minisheets bonded by different forces, the minisheet with the lowest energy would be the most likely to form.
Goals of this Study
1) To evaluate two alternatives of cellulose mini-sheet assembly
by synthesizing dye altered cellulose (DAC).
2) To determine DAC ultrastructure using x-ray diffraction and
electron microscopy.
3) To compare types of bonding in cellulose mini-sheets.
EXPERIMENTAL
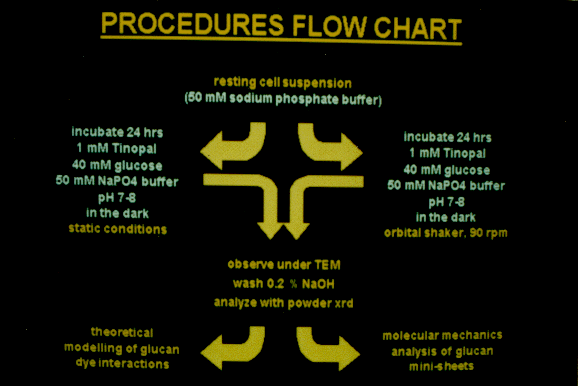
Preparation of DAC under static and shaking conditions
DAC was synthesized from resting cell suspensions incubated for
24 hr in a volume of 100 ml at a final concentration of 1 mM Tinopal
LPW™, 40 mM glucose, and 50 mM sodium phosphate buffer (pH
7-8) in the dark at room temperature. The first sample was prepared
under static conditions; the second was produced on an orbital
shaker at 90 rpm.
X-ray diffraction analysis
Powder patterns were obtained with a Philips PW 1024/30 Debye
Scherrer camera using Ni-filtered CuK (1.542 Å) radiation
at 35 kV and 25 mA. Samples for powder diffraction were washed
in 0.2% NaOH, thoroughly rinsed with deionized water, and observed
with TEM before drying. The reflections obtained were compared
to those from a control sample of bacterial cellulose synthesized
in the absence of Tinopal LPW™ and a control sample of Tinopal
LPW™ recrystallized from a 5mM stock solution by air drying.
Molecular Mechanics
The energies of various associations of glucan chains were calculated
with the molecular mechanics program MM3(92), obtained from the
Quantum Chemistry Program Exchange. The program was executed
on an IBM-PC compatible 486 computer after it was compiled with
Microsoft Power Station FORTRAN by Paul Vercellotti. Input files
for MM3 were created from Chem-X files with a utility supplied
by Dr. Alfred D. French, as was another utility for converting
MM3 output files into Chem-X files.
The original coordinates for atoms in the various mini-sheets
of cellotetraoses were generated using the crystal packing subroutine
of Chem-X, April 1993 version (developed and distributed by Chemical
Design, Ltd.). The mini-sheets for cellulose I were based on
the monoclinic, two-chain unit cell dimensions of Woodcock and
Sarko. The mini-sheets for cellulose I were generated manually
following the specifications of the Aabloo and French model using
the single chain triclinic unit cell of Sugiyama et al..
The glucan mini-sheets were then minimized with the block diagonal
matrix method of MM3(92) at = 4 and = 80. Termination of optimization
occurred when the energy change after five iterations was less
than 0.00008 kcal/atom, or 0.0278 kcal for these models. Energies
for each mini-sheet were compared to energies for an aggregate
of 4 glucan chains and for a single glucan chain multiplied by
4.
RESULTS
X-ray Diffraction analysis
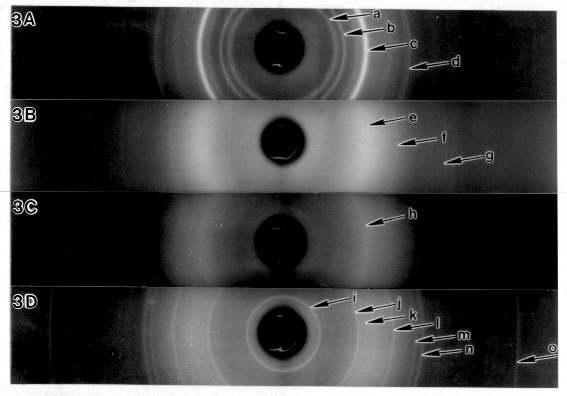
X-ray powder diffraction for bacterial cellulose (Fig. 3A) produced
reflections at 6.1 Å, 5.4 Å, 3.9 Å, and 2.6
Å, characteristic of the expected cellulose I allomorph.
The crystallized Tinopal LPW™ (Fig. 3B) produced sharp reflections
at 2.9 Å and 2.0 Å as well as a very line broadened
reflection at 4.0 Å. The sample of glucan dye sheets synthesized
under static conditions gave a single 4.0 Å reflection (Fig.
3C). The sample of glucan dye sheets synthesized under shaking
conditions gave several sharp reflections (Fig. 3D), including
the 4.0 Å and the disputed 9.4 Å reflections. Furthermore,
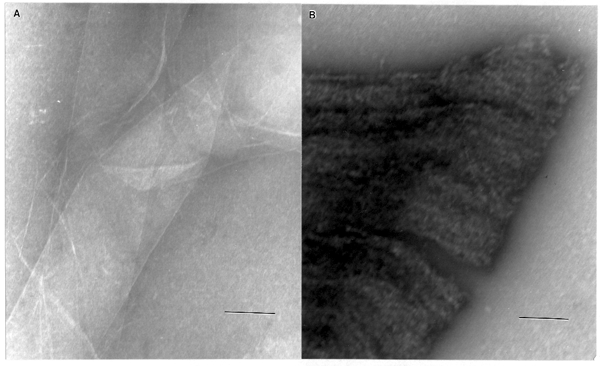
the morphology of this sample was radically different. While
the sample of glucan dye sheets synthesized under static conditions
appeared as overlapping non-microfibrillar sheets (Fig. 4A), the
sample which produced the 9.4 Å reflection appeared as fibrillar
material extending perpendicularly from the longitudinal axis
of the cells (Fig. 4B).
Theoretical Modelling of Glucan-Dye Interactions
Tinopal LPW™ molecules can interact with glucan chains by
van der Waals forces or hydrogen bonding. Five alternatives are
theoretically possible for forming sheets (Fig. 5).
Narrowing the Alternatives
Molecular Mechanics
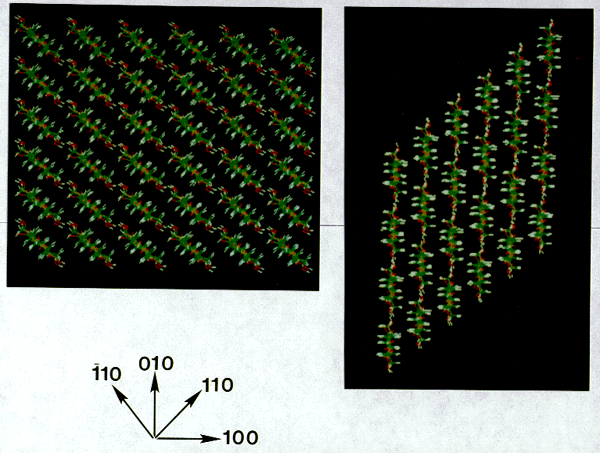
For models of cellulose I and I (Fig. 6), the energy calculations
indicate a general trend that hydrogen-bonded glucan mini-sheets
have much higher energies than mini-sheets associated by van der
Waals forces (Tables I and II). The range of energy differences
between each successive mini-sheet model was about 10 kcal, suggesting
a sufficiently notable difference between models. Furthermore,
cellulose I planes had lower energies than the corresponding planes
for cellulose I. This provides another good indication of the
merit of these models because cellulose I has been shown experimentally
to be of lower energy than cellulose I,. Energy differences also
were correlated with the quantity of inter-chain associations.
The optimized single cellotetraoses had the highest energies
when multiplied four times to increase the number of atoms for
equal comparison with the other models (no inter-chain associations),
and the mini-aggregates had the lowest energies (both types of
inter-chain associations).
DISCUSSION
Structure of DAC
The DAC produced under shaking conditions is similar in ultrastructure
to the cellulose II band material. Shaking is known to produce
band-like material. If dye molecules were present during that
process, individual dye molecules could intercalate between glucan
folds to form a true cellulose-dye complex (Fig. 7). Comparison
of the diffraction data with the alternative interactions between
glucan sheets and dye stacks supports a three-layer construction
for glucan dye sheets formed under static conditions. This three-layer
construction also is supported by the flexibility and thinness
of the material. Assembly of glucan dye sheets could be initiated
by the formation of glucan minisheets being coated on both the
upper and lower surfaces by dye stacks upon extrusion from the
TC subunits. These coated minisheets could interact laterally
to form an extended glucan dye sheet. The extended glucan dye
sheet could then helically coil to reduce strain; thus forming
a tube (Fig. 8).
Figure 8. Schematic diagram of DAC synthesized under static
conditions. Stacks of Tinopal LPW™ molecules associated
by van der Waals forces (grey ovals) saturate the upper and lower
surfaces of glucan minisheets (black rectangles) as they are extruded
from the TC subunits.
Bonding Between Glucan Chains
The formation of glucan sheets through van der Waals forces during
synthesis of native cellulose is supported by our energy
minimization analyses. While the strength of a single van der
Waals association is much reduced in comparison with a single
hydrogen bond, the sheer number of van der Waals associations
could make up the difference in energy calculated from the molecular
mechanics analysis. Furthermore, the sum of energy contributed
by the van der Waals forces is greater than the sum of energy
contributed by the hydrogen bonds. It may be argued that = 80
is unfavorably high; however, van der Waals associated glucan
chains were still favored at = 4, which stresses hydrogen bonding.
The first glucan mini-sheets most likely to form would be along
the 110 plane for cellulose I and along the 010 plane for cellulose
I.
Mechanism of Cellulose Crystallization
In the native crystallization of cellulose I, we theorize that
at least three sequential steps are involved (Fig. 9): (1) the
formation of mini-sheets held together by van der Waals forces
just after extrusion from the enzyme's catalytic site; (2) the
association of hydrogen bonded mini-sheets to form a mini-crystal
as the mini-sheets pass from the interior of the enzyme complex
subunit to the true exterior of the cell; (3) the convergence
of mini-crystals from different enzyme complex subunits to form
a crystalline microfibril.
