ATOMIC AND MOLECULAR IMAGING WITH THE TRANSMISSION ELECTRON MICROSCOPE
Judith A. Sharp and R. Malcolm Brown, Jr.Department of Botany, The University of Texas at Austin, Austin, Tx., 78713
ABSTRACT
In recent years, digital image processing has evolved to the point where it is now possible to more fully exploit the high resolution potential of the transmission electron microscope (TEM). In this study, images obtained using the Philips 420 TEM are digitized on an IBAS 2.0 using a yttrium/aluminum/garnet electron detector and Gatan camera equipped with a SIT-tube video camera. Serving as examples of the types of molecular systems which can be investigated using this unique interface are ornithine decarboxylase and bacitracin. TEM images of these specimens illustrate the ability of this technology to resolve subunit organization and morphology for high molecular weight proteins, to detect structure of low molecular weight proteins by enhancement of weak phase-contrast information, and to conduct a time-course study of structural changes of a specimen in the electron beam. Such techniques could be useful in the future for determining structural information for proteins, polysaccharides, and DNA/protein complexes which have been previously difficult or impossible to crystallize.
INTRODUCTION
The success of high resolution transmission electron microscopy (HRTEM) has often been limited by a number of factors, including poor contrast, specimen sensitivity to the electron beam, and specimen drift (O'Keefe, 1992; Spence, 1988). These factors can confound interpretation of high resolution images. Fine structures may be obscured, or absent in the final image altogether. This study attempts to provide a partial answer to these problems, by introducing a technique designed to optimize the signal-to-noise ratio and significantly decrease the exposure time of the specimen in the electron beam.
The Philips 420 TEM used in our research has a clean, high vacuum created by an ion getter pump and is housed in a unique facility designed to minimize vibrations and fluctuations in the electromagnetic field. Images obtained using the TEM are digitized on an IBAS 2.0 using a yttrium/aluminum/garnet electron detector and Gatan camera equipped with a SIT-tube video camera.
It is often the case that empirical methods used for enhancing contrast in the electron microscope can result in severely limiting resolution. Such practices include reducing the size of the objective aperture, or the introduction of a focus error (Spence, 1988). In this study, improved contrast is achieved by methods that do not interfere with point-to-point resolution, namely by digital enhancement of images obtained at true Gaussian focus.
Traditional electron micrography invariably depends on the extended exposure of the specimen during image capture. For labile biological macromolecules such as proteins, this can result in significant structural decay in the electron beam. Another difficulty associated with exposure time is specimen drift, which is often a problem at higher magnifications. Digital image capture requires only 0.033 seconds for a single input. This reflects a hundredfold reduction of the exposure time needed to capture the image when compared with film, thus any effects due to specimen drift and decay are minimized.
Presented here is a comparison between the HRTEM structural data and that obtained by X-ray crystallography and proton NMR for ornithine decarboxylase and bacitracin. Ornithine decarboxylase (ODC) is a pyridoxal phosphate-dependent dodecameric enzyme with hexagonal symmetry (Momany and Hackert, 1989; Stoops et al., 1991). Previous electron microscopy investigations have been expanded here to include dimer subunit morphology and decay in the electron beam. Bacitracin is a cyclic dodecapeptide antibiotic with a characteristic figure eight structure (Pfeffer et al., 1991; Pons et al., 1991). Already having been resolved using darkfeld HRTEM and sophisticated optical filtering and averaging techniques (Ottensmeyer et al., 1977; Ottensmeyer et al., 1978), the structure of bacitracin is shown here as a proof of our ability to resolve structures in the 5-10 Å range. The scope of this research is to demonstrate the utility of a TEM/Gatan/IBAS interface as an alternative to cyroelectron microscopy for seeking structural information of macromolecules that cannot be crystallized for X-ray diffraction data.
EXPERIMENTAL PROCEDURE
Electron Microscopy
Specimens were observed on the Philips 420 TEM using an accelerating voltage of 100 and 120 kV, the lens current at saturation (< 5 mA), and the 100 mm condenser and objective apertures. Electron images obtained on the TEM were relayed to a yttrium/aluminum/garnet electron detector and a Gatan unit equipped with a SIT-tube video camera capable of detecting light intensity levels as low as 1 x 10⁻⁶ footcandles. The signal was then digitized on an IBAS 2.0 digital image processing unit.
Digital Image Processing
Digitized images of a single input (~0.033 second exposure time) were stored on a Bernoulli disk. Subsequent digital image processing was persued with the intent of improving the signal-to-noise ratio and screening for periodic structures. This was accomplished by normalization and scaling of the image, subtraction of background noise, lowpass and pseudoplast filtering, and a fast fourier transform.
Specimen Preparation
Highly purified ornithine decarboxylase isolated from Lactobacillus sp.30a (courtesy, Marvin L. Hackert) was diluted to a concentration of 200 mg/mL in 50 mM Phosphate buffer (pH 6.5), 1 mM EDTA, and 1 mM DTT. Bacitracin was diluted in twice-distilled water to a concentration of 10 mg/mL. For TEM observation, the specimens were spread on a formvar-coated copper grid and negatively stained with a 3% solution of methylamine tungstate (Faberge and Oliver, 1974).
RESULTS
RESOLUTION STANDARD
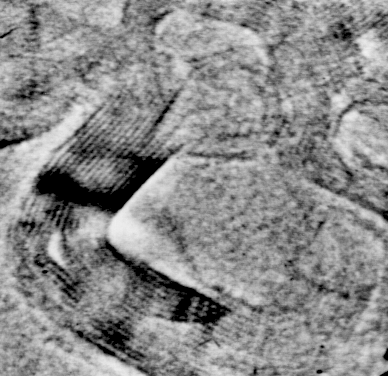
Fig. 1: Graphite is used as a control to demonstrate the resolution capabilities of the Philips 420 TEM. The periodic structure shown above represents the 3.354 Å interplanar spacing of the graphite lattice. Each lattice plane has a thickness equivalent to one carbon atom, which is 1.7 Å. The image has been averaged four times (0.33 sec exposure), normalized, scaled, and lowpass filtered for subtraction of background noise (x4,500,000).
ORNITHINE DECARBOXYLASE
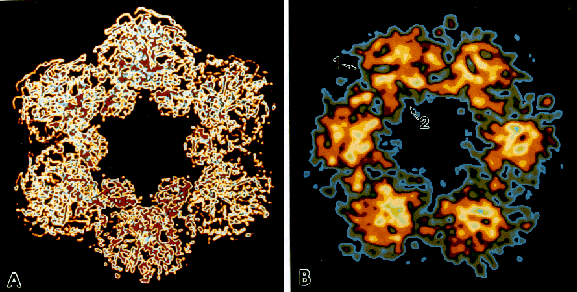
Fig. 2: A comparison of the structure of ornithine decarboxylase as resolved by X-ray crystallography and HRTEM. (A) Computer model of ornithine decarboxylase from the X-ray projection structure (courtesy, M.L. Hackert). The view depicted is along the intramolecular axis. The six dimers that make up the active enzyme aggregate to form a dodecamer with hexagonal symmetry. Also note areas of differential scattering within each dimer. The image has been converted to a color scale (x 5,200,000). (B) HRTEM structure of ornithine decarboxylase. The hexagonal symmetry of the dodecamer is represented, as well as substructural information within each dimer. Differential scattering information near the pyridoxal phosphate binding site is present to some degree in each dimer (arrow 1). Also present are the wing domains (arrow 2). The image has been normalized, scaled, lowpass filtered, enlarged and centered, rotated in 60o increments, and converted to a color scale (x4,800,000).
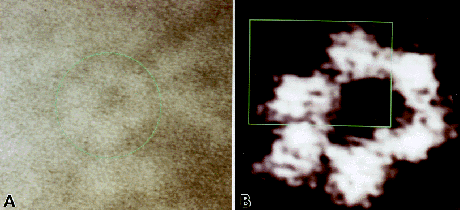
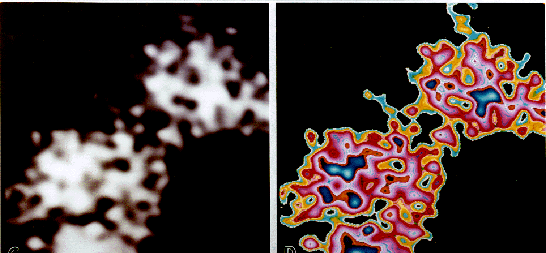
Fig. 3: Detection of dimer substructure. (A) The original input of an ODC molecule is encircled in green (x 1,900,000). (B) Contrast enhancement of the image reveals periodic structure for the dimers marked with green. The image has been normalized, scaled, lowpass and median filtered, and enlarged(x 3,800,000). (C) A fast fourier transform and enlargement of the area marked above emphasizes these areas of differential electron scattering (x 7,600,000). (D) Conversion to a color scale indicates that these areas are of a gray value distinct from other darker areas within the dimers.
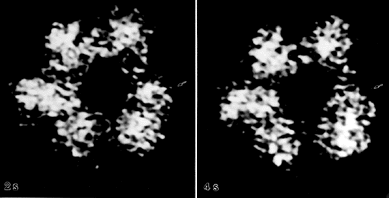

Fig. 4: Time course study of ODC decay in the electron beam. Images obtained in 2 second intervals during a 10 second exposure depict the instability of the dodecamer in the electron beam. This particular ODC molecule has a defect site, where the dodecamer has begun to dissociate. One dimer near the defect site is moving and changing orientations with respect to the rest of the dodecamer (arrows). The images have been normalized, enlarged, scaled, centered, and lowpass filtered (x 4,800,000).
BACITRACIN
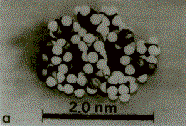
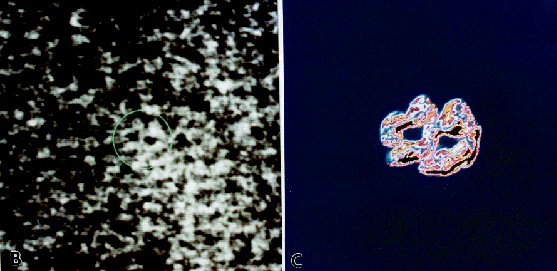
Fig. 5: A comparison of the structure of bacitracin known from proton NMR and resolved by HRTEM. (A) Spacefilling model of the structure of bacitracin as determined from the known sequence and conformational analysis (Ottensmeyer et al., 1978). Proton NMR confirms that the dodecapeptide consists of a cyclic region and a linear portion that folds over to form the characteristic figure eight structure (Kobayashi et al., 1992; Pons et al., 1991). (B) HRTEM structure of bacitracin. The bacitracin molecule is encircled in green. The image has been normalized, scaled, and enlarged. (x 10,000,000). (C) Subsequent digital enhancement of the bacitracin molecule shown in (B) reveals protuberances that may correspond to the amino acid side chains. The image has been enlarged, lowpass filtered, scaled, pseudoplast filtered, and converted to a color scale. (x 20,000,000).
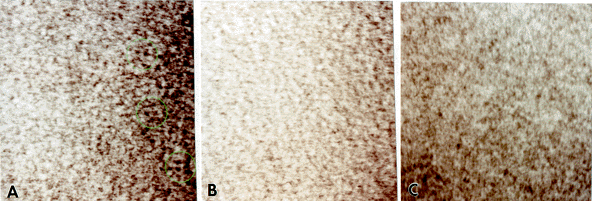
Fig. 6: HRTEM structures of bacitracin compared with controls. (A) Original image of bacitracin stained with methylamine tungstate. Bacitracin molecules are encircled in green. The lengths of twenty-four such structures were measured, yielding an average of 20.0 Å (s=1.0; x 5,000,000). (B) Formvar film control image. No bacitracin-like structures are present. (x 5,000,000). (C) Formvar film with methylamine tungstate stain control image. Again, no bacitracin-like structures are present (x 5,000,000).
DISCUSSION
Resolution Standard
The Philips 420 TEM routinely resolves the 3.354 Å interplanar lattice spacings of graphite. This indicates that the microscope is housed in a stable environment, is well aligned, and consistently achieves high resolution.
Ornithine Decarboxylase
Previous low-resolution TEM investigations of ODC have shown the hexagonal symmetry of the dodecamer (Stoops et al., 1991). Images obtained using the HRTEM/Gatan/IBAS interface show the same hexagonal symmetry, but more importantly, these images point to substructural information contained within each dimer.
Dimer subunit morphology as depicted in the HRTEM images includes differential electron scattering near the pyridoxal phosphate binding site, and the wing domains that point to the interior cavity of the molecule. Because enzymes are beam-labile structures, obtaining this kind of information supports the validity of our image capture method, which requires the specimen to be exposed as little as 0.033 seconds. Indeed, the time course study over 10 seconds revealed structural variation of the ODC molecule in the electron beam.
Bacitracin
Structures selected to be bacitracin molecules were measured along their length to compare to the reported value. Twenty-four such structures yielded an average length of 20 Å, which is precisely the value reported. The imaging of bacitracin demonstrates the ability to resolve a single polypeptide backbone. This reflects the power of this technique to resolve structures in the 5-10 Å range for a biological molecule of low scattering potential.
Future Applications
We plan to use this approach as an alternative to cryoelectron microsocpy for resolving the structure of molecules and DNA/protein complexes that are not able to be crystallized for X-ray diffraction data. Unlike cryoelectron microscopy, our approach does not compromise the vacuum or contaminate the specimen. The successful resolution of bacitracin also indicates that our methods are as good or better than the reported resolution limits for cryoelecron microscopy, which are in the 1-2 nm range (Toyoshima and Unwin, 1990; Unwin et al., 1988). The work in progress can be essentially characterized as a set of controls, in that the structural data for the molecules we are examining are already known by other methods. Other molecules currently under investigation include curdlan, cyclodextrin, and fluorinated graphite. These and other molecular systems will be used to prove the utility of the HRTEM as a tool for obtaining structural data when other methods fail.
CONCLUSIONS
(1) The imaging of the graphite lattice indicates that the TEM/Gatan/IBAS interface is resolving structures in the 3 Å range.
(2) The HRTEM images of ODC reveal hexagonal symmetry of the dodecamer, as well as dimer subunit morphology.
(3) This approach is valid for imaging an individual polypeptide chain of a low molecular weight protein, as evidenced by the successful imaging of bacitracin.
REFERENCES
Faberge, Alexander C. and Oliver, Robert M. 1974. Methylamine tungstate, a new negative stain. J. Microscopie. 20:241-246.
Kobayashi, Naohiro et al. 1992. 1H NMR study on the conformation of bacitracin A in aqueous solution. FEBS Letters. 305:105-109.
Momany, C. and Hackert, M.L. 1989. Crystallization and molecular symmetry of ornithine decarboxylase from Lactobacillus 30a. J. Biol. Chem. 264:4722-4724.
O'Keefe, Michael A. 1992. "Resolution" in high resolution electron microscopy. Ultramicroscopy. 47:282-297.
Ottensmeyer, F.P. et al. 1977. Signal to noise enhancement in darkfield electron micrographs of vasopressin: filtering of arrays of images in reciprocal space. J. of Microscopy. 109:259-268.
Ottensmeyer, F.P., Bazett-Jones, D.P., Hewitt, J., and Price, G.B. 1978. Structure analysis of small proteins by electron microscopy: vanilomycin, bacitracin and low molecular weight cell growth stimulators. Ultramicroscopy. 3:303-313.
Pfeffer, Sabine et al. 1991. X-Ray structure of the antibiotic bacitracin A. FEBS Letters. 285:115-119.
Pons, Miquel et al. 1991. Conformational analysis of bacitracin A, a naturally occuring lariat. Biopolymers. 31: 605-612.
Spence, John C.H. Experimental High Resolution Electron Microscopy. Oxford University Press, Oxford, 1988.
Stoops, James K. et al. 1991. Comparisons of the low-resolution structures of ornithine decarboxylase by electron microscopy and X-ray crystallography: the utility of methylamine tungstate stain and butvar support film in the study of macromolecules by transmission electron microcopy. J. of Electron Microscopy Technique. 18:157-166.
Toyoshima, Chikashi and Unwin, Nigel. 1990. Three-dimensional structure of the acetylcholine receptor by cryoelectron microscopy and helical image reconstruction. J. Cell Biol. 111:2623-2635.
Unwin, Nigel et al. 1988. Arrangement of the acetylcholine receptor subunits in the resting and desensitized states, determined by cryoelectron microscopy of crystallized Torpedo postsynaptic membranes. J. Cell. Biol. 107:1123- 1138.
ACKNOWLEDGEMENTS
The authors would like to extend special thanks to Dr. Marvin Hackert for his generous donation of ornithine decarboxylase. Thanks are also due to Richard Santos, Susan Cousins, Dr. Krystyna Kudlicka, and Dr. Jong Lee for their technical advice and support. This research was funded in part by Welch grant # F-1217 and ONR grant # N00014-95-1-0933 to Dr. R. Malcolm Brown, Jr.